Trade like a Professional.
Perform like an Institution.
The systematic structure, risk management, and psychological discipline that separate institutional winners from retail gamblers.
30-day free trial · No credit card required · Founding prices locked forever
You Don't Have a Strategy Problem. You Have a Visibility Problem.
Institutional traders never wonder why they lost money. Every rule break is logged, every risk limit is enforced, every behavioral pattern is flagged. You're trading blind — and paying for it with your capital.
| Aspect | Institutional Desk | Typical Retail | Tracktions |
|---|---|---|---|
| Discipline Failures | Quantified in real-time | Invisible until account is blown | Every broken rule priced in R |
| Risk Limits | Automated circuit breakers | Mental stop-losses, routinely ignored | Configurable breakers + drawdown alerts |
| Behavioral Blind Spots | Psychologist reviews, peer oversight | Trading alone, no feedback loop | 11 psychology widgets + AI insights |
| Progress Measurement | Structured reviews & milestones | "Am I profitable yet?" guessing | Phase-based journey with consistency grades |
The Problems No One Talks About
Every feature in Tracktions exists because retail traders face real, measurable problems that no spreadsheet or willpower can solve.
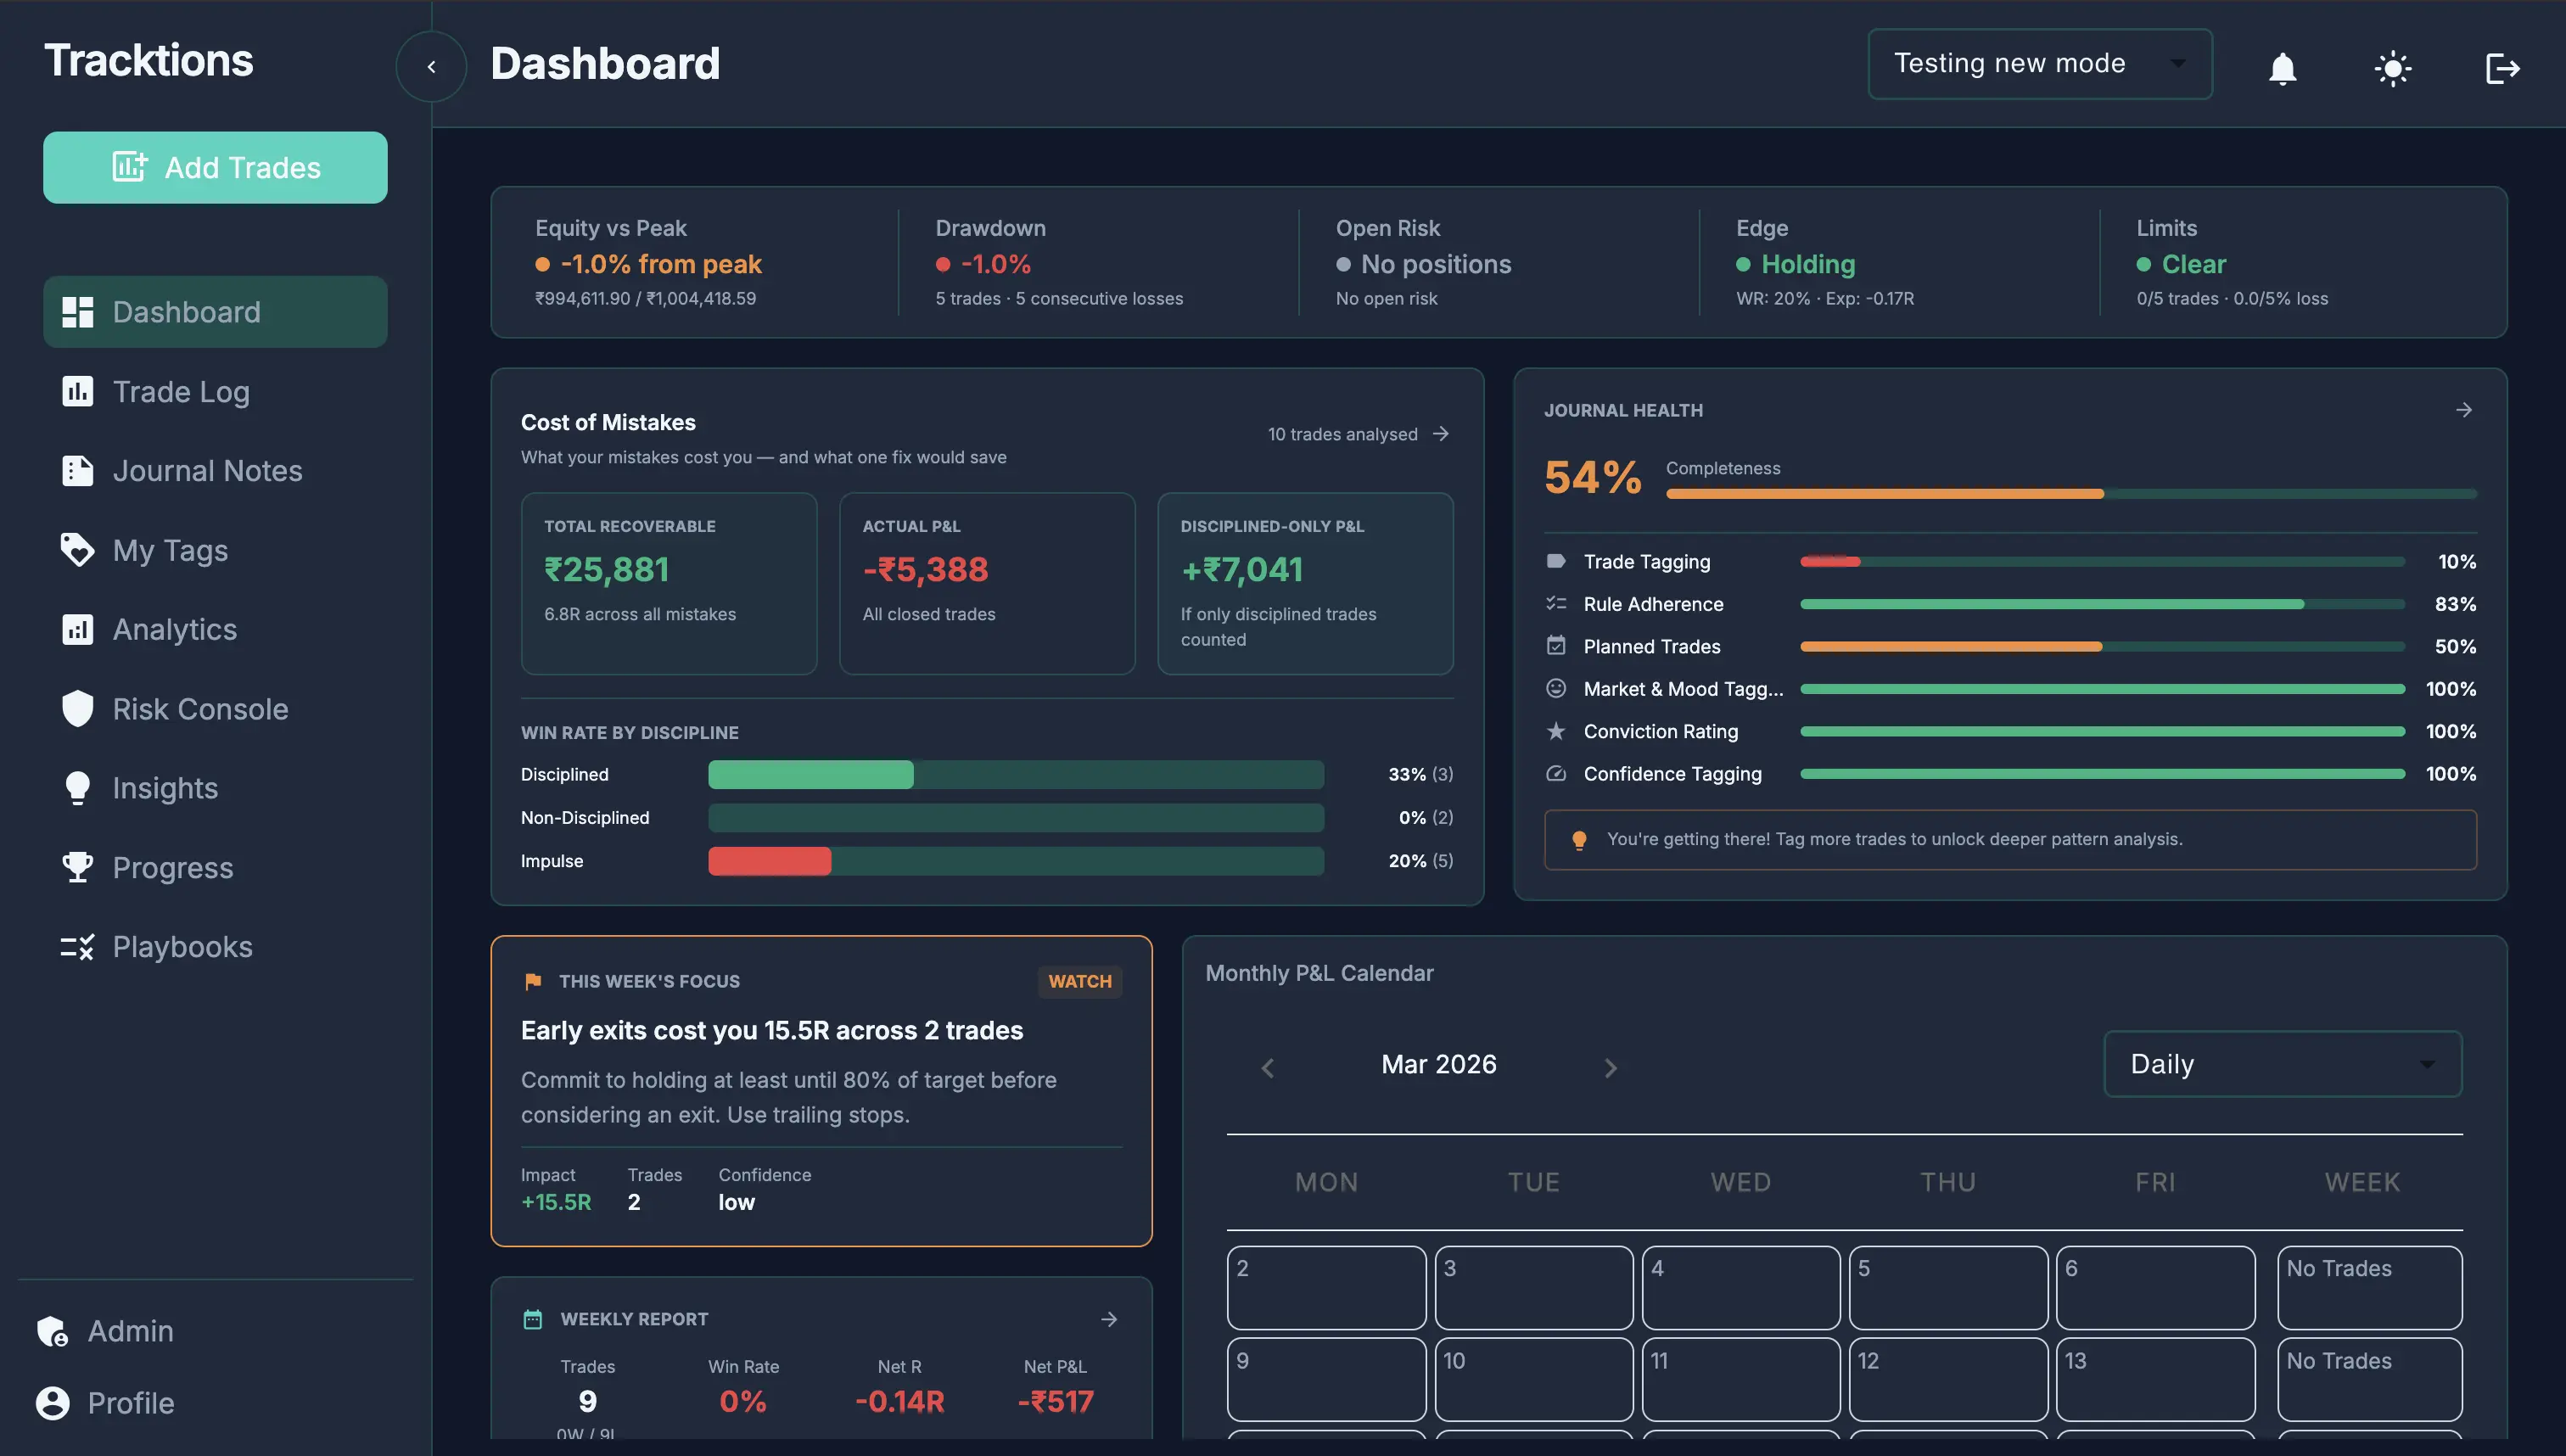
You're bleeding money from discipline failures you can't even see.
Every skipped stop-loss, every FOMO entry, every revenge trade costs real R. Without tracking it, you'll never know that broken rules cost you more than bad setups.
Your broken rules cost you 14.2R last month. Tracktions would have shown you on Day 3.
Cost of Mistakes
47 trades analysed · Last 30 days
14.2R
Recoverable
-₹18,400
Actual P&L
+₹8,200
Disciplined Only
Win Rate by Trade Type
Consistency Score
Week of Mar 24–28, 2026
76/100
Overall Consistency
Disciplined Execution
47 trades · Comparing discipline types
+₹24,600
Disciplined
31 trades · 62% WR
-₹8,200
Non-Disciplined
12 trades · 38% WR
-₹6,100
Impulse
4 trades · 25% WR
Pattern Detection
Automatic behavioral flags · Last 30 days
Revenge Trading Detected
3×Consecutive losses followed by oversized re-entries on same instrument
Overtrading Sessions
5 daysTrade count exceeded daily limit — avg 11 trades vs 8 max
FOMO Entries
4 tradesEntries after strong moves without pre-planned setup triggers
Late Session Degradation
67% lossWin rate drops from 62% to 28% after 1:30pm — fatigue pattern
Rule Adherence Improving
+12%Adherence up from 64% to 76% week-over-week
⚠ 3 critical patterns flagged this week — review before next session
By the time you realize you're in trouble, it's already too late.
Drawdowns creep up trade by trade until you're down 20% and revenge trading. Institutions have circuit breakers. You have hope.
Circuit breakers that would have stopped your worst month at -5% instead of -18%.
Risk Monitor
₹5,00,000
Capital
1% · ₹5,000
Per-Trade Risk
15% · ₹75,000
Max DD Limit
2.5% · ₹12,500
Daily Limit
Circuit Breakers
Risk-Adjusted Metrics
Profit Factor
1.31
AdequateSortino Ratio
1.42
GoodCalmar Ratio
0.87
WeakAvg Win / Loss
2.1×
Healthy₹5,00,000
Capital
1% · ₹5,000
Per-Trade Risk
15% · ₹75,000
Max DD Limit
2.5% · ₹12,500
Daily Limit
Position Size Calculator
Capital
₹5,00,000
Risk per Trade
1% · ₹5,000
Recommended Quantity
42 shares
Max risk: ₹4,998 · 1× risk unit
You have 47 charts and no idea what to fix first.
Most journals give you more dashboards. You don't need more data — you need someone to say: fix THIS, it's costing you the most.
Stop guessing what's wrong. See the #1 thing costing you money right now.
Priority Insights
Stop trading Tuesdays — 68% loss rate
Your Tuesday win rate is 32% vs 61% on other days. Avoiding Tuesdays saves you 4.1R on average per month.
Oversizing in F&O — 3 of last 5 losses exceeded risk limit
Position size exceeded 1% risk on 3 recent F&O losses, costing an extra 2.8R vs planned.
Morning sessions outperform by 2.1R — focus your best trades 9:15–11:30
Pre-noon trades average +2.1R vs −0.4R post-noon. Your edge is strongest in the opening session.
Mood vs Performance
| Mood | Trades | Win Rate | Avg R | Verdict |
|---|---|---|---|---|
| 😌 Calm | 22 | 68% | +1.8R | Trade More |
| 😰 Anxious | 11 | 36% | -0.9R | Avoid |
| 💪 Confident | 18 | 61% | +1.2R | Trade More |
| 😵 Distracted | 6 | 33% | -1.4R | Avoid |
Best state: Calm — 68% win rate, +1.8R avg across 22 trades
Time Pattern Detection
🏆 Best: Tue–Thu · 9:15–11:30am · +2.1R avg · 71% win rate
⚠ Worst: Tue · Pre-open & Post-1:30pm
Opportunity Leakage
How much potential R you leave on the table
38.4R
Max Possible R
22.1R
Captured
16.3R
Leaked
Leakage Sources
Target Capture Rate: 57.5% → Goal: 70%+
You've been 'learning' for two years and still can't tell if you're improving.
Without structured milestones, trading development feels like an endless loop. No path, no phases, no way to know if today is better than six months ago.
Know exactly where you are, what's next, and what 'improvement' actually looks like.
Path to Profitability
Positive expectancy over 50+ disciplined trades
Achievements
30-Trade Streak
First Profit Month
5-Day Discipline
Tagging Champion
In Progress
10 Consecutive Discipline
7/10Zero rule breaks for 10 trading days
Conviction Confidence
5-dimension execution scoring
74
Entry
58
Management
63
Exit
Progress Benchmarks
Your current phase vs. advancement requirements
Next Milestone: Scale with Confidence
2 of 5 criteria met. Focus: Positive expectancy over 50+ disciplined trades.
Part of Your Trading, Not Extra Work
Institutional systems live inside the trading workflow — not as separate admin tasks.
Import trades automatically
Single file upload or broker sync. Never manually log again.
Journal a trade in 20 seconds
See what's costing you money
Import Trades
Symbol
NIFTY 24000 PE
Segment
F&O
Entry Price
₹142.50
Exit Price
₹168.00
Stoploss
₹130.00
P&L
+₹1,912.50
NIFTY 24000 PE
Mar 28, 2026 · F&O · Long
+₹1,912
+1.8R
Market Condition
Mood
Conviction
Confidence
Strategy Adherence
Context
Entered early without confirmation signal. Market was choppy but I forced the trade.
Your Trading Health
Journal Health
78/100Rule Adherence This Month
Cost of Mistakes — March
5 rule violations identified
−5.2R
Recoverable
This isn't another tool you'll abandon.
It's your trading operating system — as essential as your charting platform.
Stop Paying the Discipline Tax
Every month without tracking your rule breaks, you pay a tax you can't see. Join traders who made discipline failures visible — and eliminated them.
30-day free trial · No credit card required · Founding prices locked forever